November 23, 1998.
updated October 19, 2002
Ulrich Drepper has contributed support for automatic generation of graphical flow graph representation.
GCC now contains some code which allows to emit information to allow a graphical representation of the flow graphs.
Traditionally GCC has the capability to dump information about all the instructions, basic blocks and the connections between them in textual form. This serves the purpose quite well but following the logic of the program is quite complicated and often requires drawing the flow graph on paper. This is annoying especially since the compiler already has all the information.
Quite a few programs exist that draw graphs from textual input, and we certainly accept patches to support free ones.
First you should get an impression on what the program and the gcc changes do. Take the following small program.
int
gcd (int v1, int v2)
{
  int l = v1 < v2 ? v1 : v2;
  int h = v1 + v2 - l;
  while (h > l)
    {
      h -= l;
      if (h < l)
	{
	  int tmp = l;
	  l = h;
	  h = tmp;
	}
    }
  return h;
}

int
main (int argc, char *argv[])
{
  int v1 = atol (argv[1]);
  int v2 = atol (argv[2]);
  printf ("gcd(%d, %d) = %d\n", v1, v2, gcd (v1, v2));
  return 0;
}
If you want to understand how GCC translates this
programs you use the -d option to select what GCC
should dump. E.g., giving GCC the option -da dumps
the files:
# ../cc1 -O2 -o test.o test.c -da
 gcd main
time in parse: 0.010000
[... some lines removed ...]
# ls test.c.*
test.c.addressof  test.c.cse2  test.c.jump   test.c.regmove  test.c.stack
test.c.bp         test.c.flow  test.c.jump2  test.c.rtl
test.c.combine    test.c.gcse  test.c.loop   test.c.sched
test.c.cse        test.c.greg  test.c.lreg   test.c.sched2
These files are kind of hard to read if you are not used to
RTL. Example? This is a part of test.c.lreg:
[... some lines removed ...]
Basic block 5: first insn 25, last 27.

Registers live at start: 6 7 24 25

Basic block 6: first insn 59, last 63.

Registers live at start: 6 7 25

(note 2 0 4 "" NOTE_INSN_DELETED)

;; Start of basic block 0, registers live: 6 [bp] 7 [sp] 16 []
(insn 4 2 6 (set (reg/v:SI 22)
        (mem:SI (reg:SI 16 %argp) 1)) 54 {movsi+2} (nil)
    (expr_list:REG_EQUIV (mem:SI (reg:SI 16 %argp) 1)
        (nil)))

(insn 6 4 7 (set (reg/v:SI 24)
        (mem:SI (plus:SI (reg:SI 16 %argp)
                (const_int 4)) 1)) 54 {movsi+2} (nil)
    (expr_list:REG_EQUAL (mem:SI (plus:SI (reg:SI 16 %argp)
                (const_int 4)) 1)
        (nil)))

(note 7 6 8 "" NOTE_INSN_FUNCTION_BEG)

(note 8 7 10 "" NOTE_INSN_DELETED)

(note 10 8 12 0 NOTE_INSN_BLOCK_BEG)

(insn 12 10 13 (set (reg/v:SI 23)
        (reg/v:SI 24)) 54 {movsi+2} (insn_list 6 (nil))
    (nil))
[... more lines removed ...]
All the information about the basic blocks and the instructions and so on is available but not the the most human friendly form.
This is where the new GCC features come into play.
If you add the option -dv to your
commandline you get a handful of extra files:
# ../cc1 -O2 -o test.o test.c -da -dv
 gcd main
time in parse: 0.010000
[... some lines removed ...]
# ls test.c.*.vcg
test.c.addressof.vcg  test.c.cse2.vcg  test.c.jump.vcg   test.c.regmove.vcg
test.c.bp.vcg         test.c.flow.vcg  test.c.jump2.vcg  test.c.sched.vcg
test.c.combine.vcg    test.c.gcse.vcg  test.c.loop.vcg   test.c.sched2.vcg
test.c.cse.vcg        test.c.greg.vcg  test.c.lreg.vcg   test.c.stack.vcg
If you view these files using a suitable program, you'll get output similar to the following:
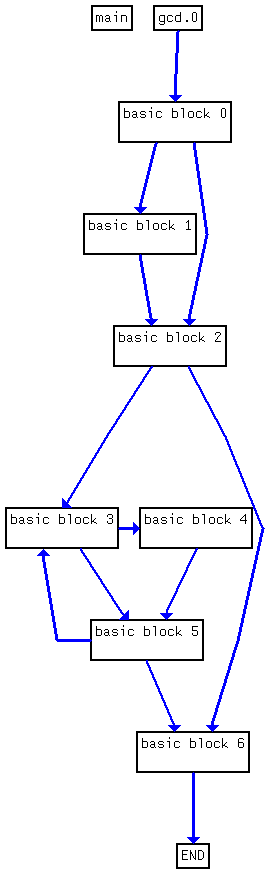
These are nodes representing all the functions in the file. If you expand the nodes you can get a picture like this.
If you have GCC later than 2.92.22 you have the necessary changes to the compiler.
Copyright (C) Free Software Foundation, Inc. Verbatim copying and distribution of this entire article is permitted in any medium, provided this notice is preserved.
These pages are maintained by the GCC team. Last modified 2022-10-26.