15.1 DESCRIPTIVES
DESCRIPTIVES
        /VARIABLES=var_list
        /MISSING={VARIABLE,LISTWISE} {INCLUDE,NOINCLUDE}
        /FORMAT={LABELS,NOLABELS} {NOINDEX,INDEX} {LINE,SERIAL}
        /SAVE
        /STATISTICS={ALL,MEAN,SEMEAN,STDDEV,VARIANCE,KURTOSIS,
                     SKEWNESS,RANGE,MINIMUM,MAXIMUM,SUM,DEFAULT,
                     SESKEWNESS,SEKURTOSIS}
        /SORT={NONE,MEAN,SEMEAN,STDDEV,VARIANCE,KURTOSIS,SKEWNESS,
               RANGE,MINIMUM,MAXIMUM,SUM,SESKEWNESS,SEKURTOSIS,NAME}
              {A,D}
The DESCRIPTIVES procedure reads the active dataset and outputs
linear descriptive statistics requested by the user. In addition, it can optionally
compute Z-scores.
The VARIABLES subcommand, which is required, specifies the list of
variables to be analyzed. Keyword VARIABLES is optional.
All other subcommands are optional:
The MISSING subcommand determines the handling of missing variables. If
INCLUDE is set, then user-missing values are included in the
calculations. If NOINCLUDE is set, which is the default, user-missing
values are excluded. If VARIABLE is set, then missing values are
excluded on a variable by variable basis; if LISTWISE is set, then
the entire case is excluded whenever any value in that case has a
system-missing or, if INCLUDE is set, user-missing value.
The FORMAT subcommand has no effect. It is accepted for
backward compatibility.
The SAVE subcommand causes DESCRIPTIVES to calculate Z scores for all
the specified variables. The Z scores are saved to new variables.
Variable names are generated by trying first the original variable name
with Z prepended and truncated to a maximum of 8 characters, then the
names ZSC000 through ZSC999, STDZ00 through STDZ09, ZZZZ00 through
ZZZZ09, ZQZQ00 through ZQZQ09, in that sequence. In addition, Z score
variable names can be specified explicitly on VARIABLES in the variable
list by enclosing them in parentheses after each variable.
When Z scores are calculated, PSPP ignores TEMPORARY,
treating temporary transformations as permanent.
The STATISTICS subcommand specifies the statistics to be displayed:
ALLAll of the statistics below.
MEANArithmetic mean.
SEMEANStandard error of the mean.
STDDEVStandard deviation.
VARIANCEVariance.
KURTOSISKurtosis and standard error of the kurtosis.
SKEWNESSSkewness and standard error of the skewness.
RANGERange.
MINIMUMMinimum value.
MAXIMUMMaximum value.
SUMSum.
DEFAULTMean, standard deviation of the mean, minimum, maximum.
SEKURTOSISStandard error of the kurtosis.
SESKEWNESSStandard error of the skewness.
The SORT subcommand specifies how the statistics should be sorted. Most
of the possible values should be self-explanatory. NAME causes the
statistics to be sorted by name. By default, the statistics are listed
in the order that they are specified on the VARIABLES subcommand.
The A and D settings request an ascending or descending
sort order, respectively.
15.1.1 Descriptives Example
The physiology.sav file contains various physiological data for a sample
of persons. Running the DESCRIPTIVES command on the variables height
and temperature with the default options allows one to see simple linear
statistics for these two variables. In Example 15.1, these variables
are specfied on the VARIABLES subcommand and the SAVE option
has been used, to request that Z scores be calculated.
After the command has completed, this example runs DESCRIPTIVES again, this
time on the zheight and ztemperature variables,
which are the two normalized (Z-score) variables generated by the
first DESCRIPTIVES command.
get file='physiology.sav'.

descriptives
        /variables = height temperature
        /save.

descriptives
        /variables = zheight ztemperature.
|
Example 15.1: Running two DESCRIPTIVES commands, one with the SAVE subcommand
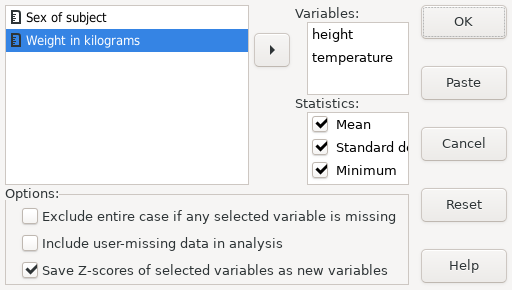 |
Screenshot 15.1: The Descriptives dialog box with two variables and Z-Scores option selected
In Result 15.1, we can see that there are 40 valid data for each of the variables and no missing values. The mean average of the height and temperature is 16677.12 and 37.02 respectively. The descriptive statistics for temperature seem reasonable. However there is a very high standard deviation for height and a suspiciously low minimum. This is due to a data entry error in the data (see Identifying incorrect data).
In the second Descriptive Statistics command, one can see that the mean and standard deviation of both Z score variables is 0 and 1 respectively. All Z score statistics should have these properties since they are normalized versions of the original scores.
|
Result 15.1: Descriptives statistics including two normalized variables (Z-scores)