3.2 A photo lens design
3.2.1 Using the Lens component
The Sys::Lens class is a convenient way to model a list of optical surfaces. In this example we use it to model a Tessar photo lens by adding all optical surfaces to the lens object. Several functions are available to add surfaces to the lens; one of the simplest can create spherical surfaces with circular aperture for us. In this example, the glass material models used are created on the fly:
// code from examples/tessar_lens/tessar.cc:70

  Sys::Lens     lens(Math::Vector3(0, 0, 0));

  //               roc,            ap.radius, thickness,

  lens.add_surface(1/0.031186861,  14.934638, 4.627804137,
                   ref<Material::AbbeVd>::create(1.607170, 59.5002));

  lens.add_surface(0,              14.934638, 5.417429465);

  lens.add_surface(1/-0.014065441, 12.766446, 3.728230979,
                   ref<Material::AbbeVd>::create(1.575960, 41.2999));

  lens.add_surface(1/0.034678487,  11.918098, 4.417903733);

  lens.add_stop   (                12.066273, 2.288913925);

  lens.add_surface(0,              12.372318, 1.499288597,
                   ref<Material::AbbeVd>::create(1.526480, 51.4000));

  lens.add_surface(1/0.035104369,  14.642815, 7.996205852,
                   ref<Material::AbbeVd>::create(1.623770, 56.8998));

  lens.add_surface(1/-0.021187519, 14.642815, 85.243965130);

  sys.add(lens);
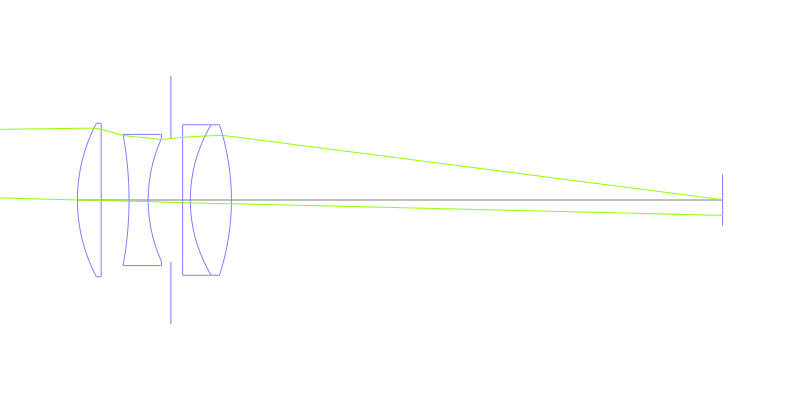
3.2.2 Adding multiple light sources
The Sys::SourcePoint class can be used to create a point light source suitable for analysis, but we sometimes want to trace custom rays. This can be achieved by using the Sys::SourceRays component class.
In this example we add both source types to our system but enable a single one at the same time. The Sys::SourceRays is used to draw a 2d layout with chief and marginal rays whereas the Sys::SourcePoint source is used with multiple wavelengths for ray fan and spot diagram analysis:
  Sys::SourceRays  source_rays(Math::Vector3(0, 27.5, -1000));

  Sys::SourcePoint source_point(Sys::SourceAtFiniteDistance,
                                Math::Vector3(0, 27.5, -1000));

  // add sources to system
  sys.add(source_rays);
  sys.add(source_point);

  // configure sources
  source_rays.add_chief_rays(sys);
  source_rays.add_marginal_rays(sys, 14);

  source_point.clear_spectrum();
  source_point.add_spectral_line(Light::SpectralLine::C);
  source_point.add_spectral_line(Light::SpectralLine::e);
  source_point.add_spectral_line(Light::SpectralLine::F);
The object is located at -1000 on the Z axis and has a height of 27.5.
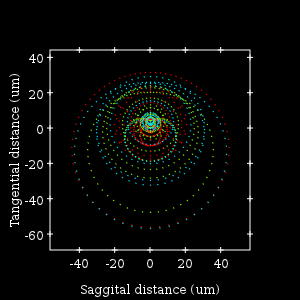
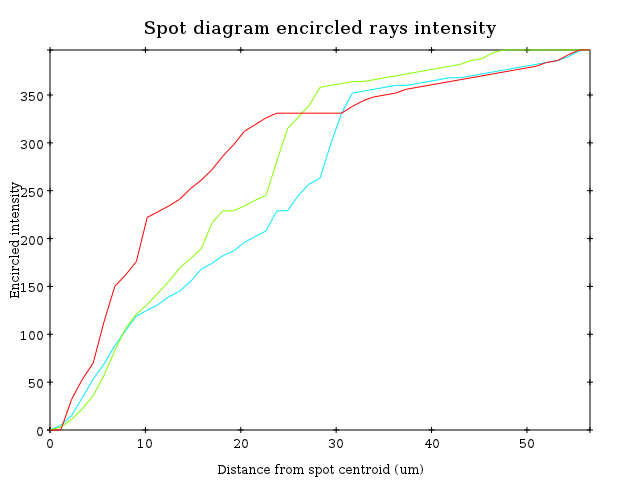
3.2.3 Plotting spot diagram
The Analysis::Spot class can be used to plot spot diagrams:
    sys.enable_single<Sys::Source>(source_point);

    sys.get_tracer_params().set_default_distribution(
      Trace::Distribution(Trace::HexaPolarDist, 12));

    Analysis::Spot spot(sys);

      Io::RendererSvg renderer("spot.svg", 300, 300, Io::rgb_black);

      spot.draw_diagram(renderer);
      Io::RendererSvg renderer("spot_intensity.svg", 640, 480);

      ref<Data::Plot> plot = spot.get_encircled_intensity_plot(50);

      plot->draw(renderer);
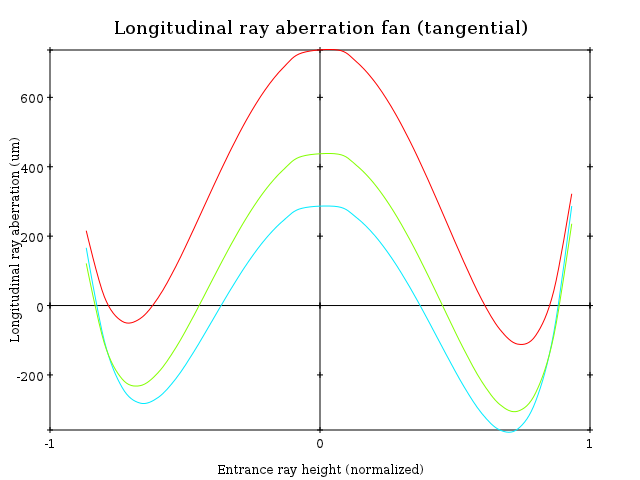
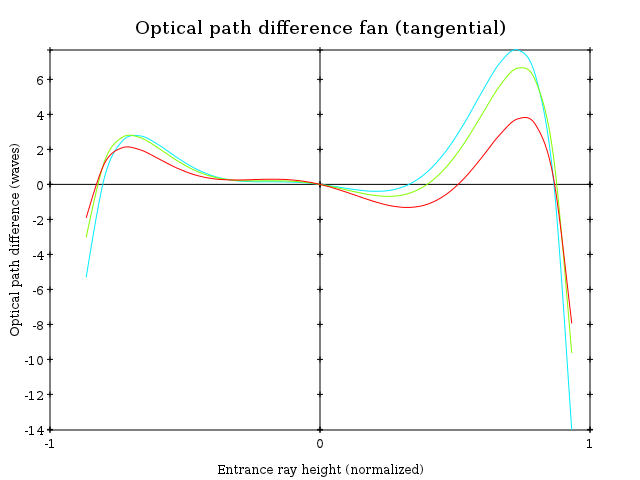
3.2.4 Plotting ray fans
Various ray fan plots can be obtained by using the Analysis::RayFan class:
    sys.enable_single<Sys::Source>(source_point);

    Analysis::RayFan fan(sys);

      Io::RendererSvg renderer("opd_fan.svg", 640, 480);

      ref<Data::Plot> fan_plot = fan.get_plot(Analysis::RayFan::EntranceHeight,
                                              Analysis::RayFan::OpticalPathDiff);

      fan_plot->draw(renderer);
      Io::RendererSvg renderer("transverse_fan.svg", 640, 480);

      ref<Data::Plot> fan_plot = fan.get_plot(Analysis::RayFan::EntranceHeight,
                                              Analysis::RayFan::TransverseDistance);

      fan_plot->draw(renderer);
      Io::RendererSvg renderer("longitudinal_fan.svg", 640, 480);

      ref<Data::Plot> fan_plot = fan.get_plot(Analysis::RayFan::EntranceHeight,
                                              Analysis::RayFan::LongitudinalDistance);

      fan_plot->draw(renderer);