15.12.2 Chi-square Test 
[ /CHISQUARE=var_list[(lo,hi)] [/EXPECTED={EQUAL|f1, f2 ... fn}] ]
The /CHISQUARE subcommand produces a chi-square statistic for the differences
between the expected and observed frequencies of the categories of a variable.
Optionally, a range of values may appear after the variable list.
If a range is given, then non integer values are truncated, and values
outside the specified range are excluded from the analysis.
The /EXPECTED subcommand specifies the expected values of each
category.
There must be exactly one non-zero expected value, for each observed
category, or the EQUAL keyword must be specified.
You may use the notation n*f to specify n
consecutive expected categories all taking a frequency of f.
The frequencies given are proportions, not absolute frequencies. The
sum of the frequencies need not be 1.
If no /EXPECTED subcommand is given, then equal frequencies
are expected.
15.12.2.1 Chi-square Example 
A researcher wishes to investigate whether there are an equal number of persons of each sex in a population. The sample chosen for invesigation is that from the physiology.sav dataset. The null hypothesis for the test is that the population comprises an equal number of males and females. The analysis is performed as shown in Example 15.5.
get file='physiology.sav'.

npar test
     /chisquare=sex.
|
Example 15.5: Performing a chi-square test to check for equal distribution of sexes
There is only one test variable, viz: sex. The other variables in the dataset are ignored.
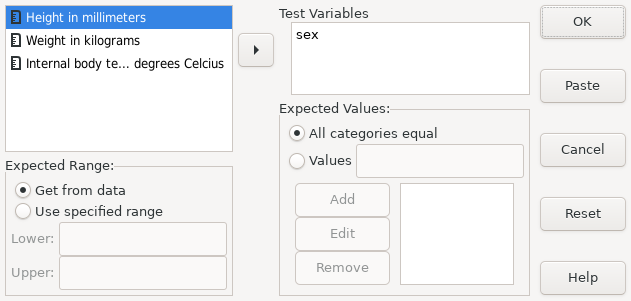 |
Screenshot 15.4: Performing a chi-square test using the graphic user interface
In Result 15.4 the summary box shows that in the sample, there are more males than females. However the significance of chi-square result is greater than 0.05 — the most commonly accepted p-value — and therefore there is not enough evidence to reject the null hypothesis and one must conclude that the evidence does not indicate that there is an imbalance of the sexes in the population.
|
Result 15.4: The results of running a chi-square test on sex