13.5 SPLIT FILE
SPLIT FILE [{LAYERED, SEPARATE}] BY var_list.
SPLIT FILE OFF.
SPLIT FILE allows multiple sets of data present in one data
file to be analyzed separately using single statistical procedure
commands.
Specify a list of variable names to analyze multiple sets of data separately. Groups of adjacent cases having the same values for these variables are analyzed by statistical procedure commands as one group. An independent analysis is carried out for each group of cases, and the variable values for the group are printed along with the analysis.
When a list of variable names is specified, one of the keywords
LAYERED or SEPARATE may also be specified. With
LAYERED, which is the default, the separate analyses for each
group are presented together in a single table. With
SEPARATE, each analysis is presented in a separate table.
Not all procedures honor the distinction.
Groups are formed only by adjacent cases. To create a split using a variable where like values are not adjacent in the working file, first sort the data by that variable (see SORT CASES).
Specify OFF to disable SPLIT FILE and resume analysis of the
entire active dataset as a single group of data.
When SPLIT FILE is specified after TEMPORARY, it affects only
the next procedure (see TEMPORARY).
13.5.1 Example Split
The file horticulture.sav contains data describing the yield
of a number of horticultural specimens which have been subjected to
various treatments. If we wanted to investigate linear statistics
of the yeild, one way to do this is using the DESCRIPTIVES (see DESCRIPTIVES).
However, it is reasonable to expect the mean to be different depending
on the treatment. So we might want to perform three separate
procedures — one for each treatment.
5
Example 13.2 shows how this can be done automatically using
the SPLIT FILE command.
get file='horticulture.sav'. * Ensure cases are sorted before splitting. sort cases by treatment. split file by treatment. * Run descriptives on the yield variable descriptives /variable = yield. |
Example 13.2: Running DESCRIPTIVES on each value of treatment
In Example 13.3 you can see that the table of descriptive statistics appears 3 times — once for each value of treatment. In this example ‘N’, the number of observations are identical in all splits. This is because that experiment was deliberately designed that way. However in general one can expect a different ‘N’ for each split.
|
Example 13.3: The results of running DESCRIPTIVES with an active split
Unless TEMPORARY was used, after a split has been defined for
a dataset it remains active until explicitly disabled.
In the graphical user interface, the active split variable (if any) is
displayed in the status bar (see Screenshot 13.1.
If a dataset is saved to a system file (see SAVE) whilst a split
is active, the split stastus is stored in the file and will be
automatically loaded when that file is loaded.
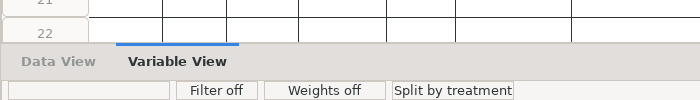 |
Screenshot 13.1: The status bar indicating that the data set is split using the treatment variable