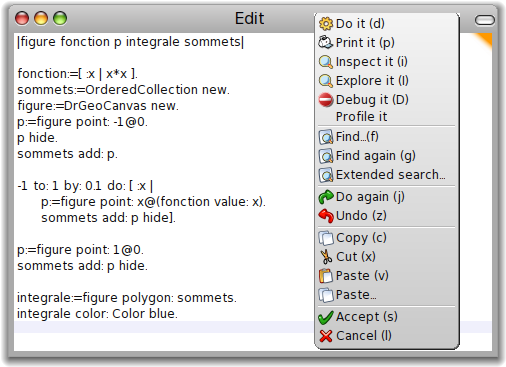
Figure 7.1: Your workspace with the pasted source code and its contextual menu
Next: Glossary, Previous: Didactic applications, Up: Top [Contents][Index]
Due to Dr.Geo integration with the Pharo Smalltalk environment, there are a few genies we can invoke. Most of them are hidden to the user. It is not that we want to restrain their use, but that we don’t want to overload the user when discovering Dr.Geo. As we will show in the following sections, these genies can be invoked from menus, keyboard shortcuts or Smalltalk code.
In this section we present a few tools to use when writing Smalltalk scripts or composing sketches, beginning with the workspace, the debugger, and the inspector.
To show a workspace, click on the Dr.Geo environment background then do Ctrl-k16.
A workspace, at first glance, is like a text editor. But it is in fact a console to edit Smalltalk code: to write it, to compile it, and to execute it. It is of course possible to paste in code copied from somewhere else.
After invoking a workspace, paste the source code of the Smalltalk sketch below17:
| sketch function p integral summits |

function := [:x | x * x ].
summits := OrderedCollection new.
sketch := DrGeoSketch new.
p := sketch point: -1@0.
p hide.
summits add: p.

-1 to: 1 by: 0.1 do: [:x |
   p := sketch point: x @ (function value: x).
   summits add: p hide].

p := sketch point: 1@0.
summits add: p hide.

integral := sketch polygon: summits.
integral color: Color blue.
To compile and to execute this source code, just select it with the mouse and invoke Do it(d) in the contextual menu. These two operations can also be done at the keyboard: Ctrl-a to select all the source code then Ctrl-d to execute it. You immediately get the result of this code, an interactive programmed sketch.
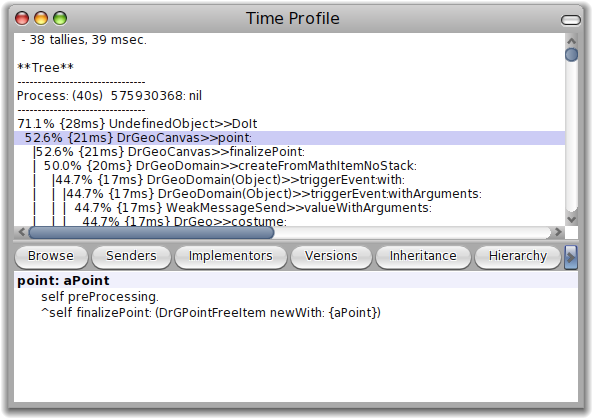
When executing complex Smalltalk code, running it with a profiling option let you see its bottlenecks. To do so, in the contextual menu invoke the command Profile it. The source code is executed, the sketch is built, and then a profile window informs you about the execution time in different part of the code and the various invoked methods. It is a wonderful way to navigate the execution tree of the code and look for methods consuming too many cycles.
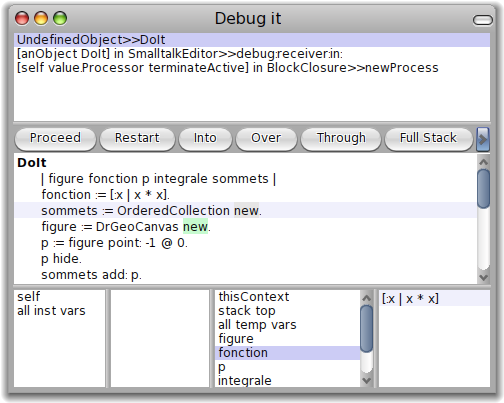
Last refinement: stepping through code. This is done through the debugger. Select the code to debug, then in the contextual (right-click) menu, choose the command Debug it. The debugger is invoked on the first line of the selected source code, which is executed step by step with the button Over, one method call at a time. In the bottom area of the debugger window, at the right, the local variables are shown with type information. Other buttons allow other refinements in step by step execution. You should explore them before looking at Smalltalk documentation.
As shown in the previous section, the debugger lets you execute the code step by step. In the Dr.Geo environment you can invoke the debugger on any selected code in a workspace with the keyboard shortcut Alt-D.
Moreover, the debugger can be invoked in the source code by adding a
line self halt. – like a breakpoint. In our previous
example we modify the source code as follow:
...
p := sketch point: -1@0.
p hide.
summits add: p.

self halt.

-1 to: 1 by: 0.1 do: [:x |
   p := sketch point: x @ (function value: x).
   summits add: p hide].
...
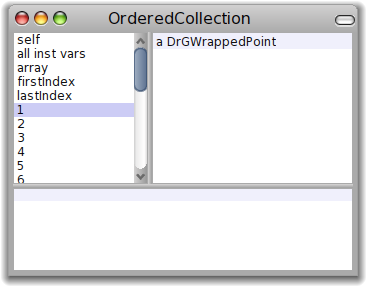
In the inspector dialogue, the user examines the attributes of an instance or a variable. The information in the view is updated automatically whenever the inspected object changes.
In our previous example, suppose we want to see the contents of the
summits collection. In this case, we very simply add a
line of code to send the message inspect to
summits. The place in the code where we put it is not very
important18. It can be at the beginning or the end because we do not have a
breakpoint or step by step execution:
...
p := sketch point: -1@0.
p hide.
summits add: p.

summits inspect.

-1 to: 1 by: 0.1 do: [:x |
   p := sketch point: x @ (function value: x).
   summits add: p hide].
...
Depending one your system, replace Ctrl by Alt.
To paste a text, try with the shortcut Ctrl-v or from its contextual menu (right click).
For obvious reasons, we must avoid adding it in the loop.
Next: Glossary, Previous: Didactic applications, Up: Top [Contents][Index]