Figure 5.1: Triangle de Sierpinski
Next: Didactic applications, Previous: Smalltalk script, Up: Top [Contents][Index]
Dr.Geo Smalltalk sketches – (DSS) – are sketches entirely defined in the Smalltalk language. This is not about constructing a sketch with the Dr.Geo graphical interface, but about describing a sketch with the Smalltalk language. We provide a nice programming interface with an easy and light syntax.
Smalltalk itself is a high level language, carefully crafted iteratively for about 10 years at Xerox Parc Research Labs. When a sketch is defined with it, we can use all the power of the language to build a sketch, or to position some objects randomly to get a slightly different sketch at each execution of its Smalltalk code. Therefore, a Smalltalk sketch is freed from the constraints of the graphic user interface while reinforced by the Smalltalk language.
A Smalltalk sketch is source code to execute in a workspace, which is a text editor where source code can be written and executed. To open one, use the shortcut Ctrl-k when no window is selected – or click on the background and in the menu select Tools→Workspace. It is possible to paste text in with the shortcut Ctrl-v. (See workspace to learn more about this tool).
Smalltalk sketches are not saved within Dr.Geo. They must be pasted to an external text editor and saved to external files in order to be available for reuse in Dr.Geo. Then the text must be copied from the external file and pasted into a Dr.Geo workspace in order to be executed again.
To introduce the concepts of Smalltalk sketches, we will study a few examples. Each one will be written in a workspace and its source code will be selected with mouse, then executed with the shortcut Ctrl-d to Do-it!14.
Let’s start with the simplest possible Smalltalk sketch:
DrGeoSketch new
When executing it, it simply creates a new empty sketch. The Dr.Geo canvas displayed is simplified as there is no toolbar, only the menu bar.
A second example that begins to do something:
| c item |
c := DrGeoSketch new.
item := c point: 1.2 @ -2.
item name: 'A'.
Here we define a sketch containing a free point A of coordinates (1,2 ; -2). An object is added to the construction by sending a message to the canvas, here #point: to create a free point given its coordinates. The result is a point object. We can also modify the point by sending a message to it. Here we rename it ’A’.
Let’s continue with a third, more interesting example:
| c triangle ourRandom m n p |

triangle := [:p1 :p2 :p3 |
	c segment: p1 to: p2.
	c segment: p2 to: p3.
	c segment: p3 to: p1].

ourRandom := [6 - 11 atRandom].

c := DrGeoSketch new.
m := c point: ourRandom value @ 0.
n := c point: 5 @ 0.
p := c point:  ourRandom value @ 3.
triangle value: m value: n value: p.
This example shows us three interesting things:
To finish with this introduction by example, here is the last one:
| c a b d |

c := DrGeoSketch new.
a := c point: 1@0.
b := c point: 5@0.
d := c line: a to: b.
a color: Color yellow;
   round;
   large.
b hide.
d dashed.
Two points and a line are constructed. Then messages are sent to them to modify their styles, including hiding one.
We have finished our small guided tour of Dr.Geo Smalltalk sketches. In the following sections, we expose the commands available.
To add an object to a construction, you send a message to the canvas. The resulting constructed object can be modified as well by sending messages to it. So before adding any object to a canvas, we need to create the canvas with the command DrGeoSketch new.
⇒ Return a canvas and open it. The result is normally assigned to a variable for later use to add constructions.
| canvas |
canvas := DrGeoSketch  new.
The sketch is set to fill the Dr.Geo window.
| canvas |
canvas := DrGeoSketch new.
canvas fullscreen
block, Smalltalk block of code with instructions for construction and/or animation of the sketch.
Execute the block of code in a specific background process. Use it when a construction needs to be done step by step in front of the user or when the sketch is animated.
| canvas point |
canvas := DrGeoSketch new.
canvas fullscreen.
point := canvas point: 0@0.
canvas do: [
   -5 to: 5 by: 0.1 do: [:x |
      point moveTo: x @ (x cos * 3).
      (Delay forMilliseconds: 100) wait.
      canvas update]
]
Update the canvas after some objects were modified. Used mainly for animation, or for modifications that do not cause an update themselves.
Display the grid in the canvas.
aPoint, coordinates of a point
The canvas is displaced so the point given by the argument is at the centre of the canvas window.
canvas centerTo: 5@0
anInteger, scale of the canvas
Modify the scale of the canvas.
canvas scale: 10
aPoint, coordinates (x,y)
⇒ free point in the plane with coordinates aPoint.
canvas point: 5@2.
v1, value object
v2, value object
⇒ point determined by its coordinates in the form of values placed in the sketch
canvas
   pointX: (canvas freeValue: 2) hide
   Y: (canvas freeValue: 5) hide.
curve, line (straight line, ray, segment, etc.)
abscissa, curvilinear abscissa of the free point, abscissa in interval [0 ; 1]
⇒ free point on a line
myPoint := canvas pointOnCurve: s1 at: 0.5.
p1, point item or coordinates
p2, point item or coordinates
⇒ middle of two points
| canvas a i |
canvas := DrGeoSketch new.
a := canvas point: 1@1.
i := canvas middleOf: a and: 4@4.
s, segment
⇒ middle of a segment
canvas middleOf: s.
l1, line
l2, line
⇒ point of intersection of two lines
canvas intersectionOf: line1 and: line2
l1, line
l2, line
⇒ second point of intersection of two lines, when it exists
canvas altIntersectionOf: line and: circle.
block, block of code returning coordinates
item, math item
⇒ pointBlockItem whose coordinates are calculated with the block of code with “item” as argument
| figure s mobile c block |
figure := DrGeoSketch new.
figure fullscreen.
s:=figure
   segment: (figure point: -5@0)
   to: (figure point: 5@0).
mobile := figure pointOnCurve: s at: 0.1.
block := [:mathItem | |x|
   x := mathItem point x.
   x  (x * x * x / 25 - x)].
c := figure point: block parent: mobile.
figure locusOf: c when: mobile.
block, block of code returning coordinates
collection, math item collection
⇒ point whose coordinates are calculated with the block of code with “collection” as argument
| figure a b d m p |
figure:=DrGeoSketch new.
a:=figure point: (-2)@1.
b:=figure point: 3@3.
d:=figure line: a to: b.
d color: Color blue.
m:=figure point: 1@(-1).
p:= figure
   point: [:parents | parents first closestPointTo: parents second point]
   parents: {d . m}.
This example uses array notation { . } to provide the collection needed.
p1, point or coordinates
p2, point or coordinates
⇒ line passing through these two points
| canvas p1 |
canvas := DrGeoSketch new.
p1 := canvas point: 0@0.
canvas line: p1 to: 1@2.
Note that if one or both arguments are given as literals, those points are not drawn, and are not available in the sketch to click and drag. The direction of the line thus cannot be changed interactively.
d, direction (line, segment, vector,...)
p, point or coordinates
⇒ line parallel to direction d and passing through point p
| canvas a d |
canvas := DrGeoSketch new.
a := canvas point: 1@5.
d := canvas line: (-2)@1 to: 3@3.
canvas parallel: d at: a.
p, point or coordinates
d, direction (line, segment, vector, ...)
⇒ line perpendicular to direction d and passing through point p
canvas perpendicular: d at: 1@5.
s, segment
⇒ perpendicular bisector to s
canvas perpendicularBisector: (canvas segment: 0@0 to: 4@4)
a, point or coordinates
b, point or coordinates
⇒ perpendicular bisector to segment joining a and b
canvas perpendicularBisector: 0@0 to: 4@4
a, geometric angle defined by three points
⇒ angle bisector of the angle a
canvas angleBisector: angle
a,b,c, points defining a geometric angle BAC
⇒ angle bisector of the angle BAC
canvas angleBisectorSummit: 0@0 side1: 1@0 side2: 0@1
o, point or coordinate, the origin
p, point or coordinates, point anywhere on the ray
⇒ ray defined by its origin and a second point
| canvas a |
canvas := DrGeoSketch new.
a := canvas point: 1@5.
canvas ray: 0@0 to: a.
p1, points or coordinates
p2, points or coordinates
⇒ segment defined by two points
| canvas a |
canvas := DrGeoSketch new.
a := canvas point: 5@5.
canvas segment: 10@10 to: a.
c, point or coordinates, centre of the circle
p, point or coordinates, point on the circle
⇒ circle defined by its centre and a point
| canvas a |
canvas := DrGeoSketch new.
a := canvas point: 1@5.
canvas circleCenter: a to: 10@4.
c, point or coordinates, centre of the circle
r, numeric item or numeric value, radius
⇒ circle defined by its centre and radius
| canvas a r |
canvas := DrGeoSketch new.
a := canvas point: 1@5.
r := canvas freeValue: 4.
canvas circleCenter: a radius: r.
canvas circleCenter: 4@4 radius: 5
p1, point or coordinates, 1st extremity of the arc
p2, point or coordinates representing a point on arc
p3, point or coordinates, 2nd extremity of the arc
⇒ arc defined by its extremities and a point
| canvas a b |
canvas := DrGeoSketch new.
a := canvas point: 1@5.
b := canvas point: 0@5.
canvas arc: a to: b to: -1 @ -2.
o, point or coordinates, centre of the arc
a, point or coordinates, origin of the arc
b, point or coordinates, so the angle is AOB
⇒ arc defined by its centre and angle AOB
| canvas a b |
canvas := DrGeoSketch new.
a := canvas point: 1@5.
b := canvas point: 0@5.
canvas arcCenter: a from: b to: -1 @ -2.
collection, collection of points or coordinates; vertices of the polygon
⇒ polygon defined by its vertices
| canvas b |
canvas := DrGeoSketch new.
b := canvas point: 1@3.
canvas polygon: {1@2. b. 0@0. d}
c, point or coordinates, centre of the polygon
s, point or coordinate, a vertex of the polygon
n, value item or numeric value, number of vertices of the polygon
⇒ regular polygon defined by its centre, one vertex and number of vertices
| canvas b |
canvas := DrGeoSketch new.
b := canvas point: 1@3.
canvas regularPolygonCenter: b vertex: 1@1 sides: 7.
Geometric transformations are to transform any kind of geometric objects: point, segment, line, ray, vector, circle, arc and polygon.
i, object to transform (point, segment, line, ray, vector, circle, arc, polygon)
c, point or coordinates, rotation centre
a, value item or numeric value, rotation angle
⇒ transformed object
| canvas c k l |
canvas := DrGeoSketch new.
c := canvas point: 5@5.
k := 3.14159.
l := canvas line: 0@0 to: 5@5.
canvas rotate: l center: c angle: k.
canvas rotate: l center: 0@0 angle: Float pi / 3.
i, object to transform (point, segment, line, ray, vector, circle, arc, polygon)
c, point or coordinates, homothety centre
k, value item or numeric value, homothety factor
⇒ transformed object
| canvas c k l |
canvas := DrGeoSketch new.
c := canvas point: 0@5.
k := -3.
l := canvas line: 0@0 to: 5@5.
canvas scale: l center: c factor: k.
canvas scale: l center: 0@4 factor: 5.
i, point, segment, line, ray, vector, circle, arc, polygon
c, point or coordinates, symmetry centre
⇒ transformed object
| canvas a |
canvas := DrGeoSketch new.
a := canvas point: 4@2.
canvas symmetry: a center: 0@0.
item, point, segment, line, ray, vector, circle, arc, polygon
axe, line, symmetry axis
⇒ transformed object
| canvas a d polygon |
canvas := DrGeoSketch new.
a := canvas polygon: {0@0 . 2@0 . 3@2 . 0@4}
d := canvas line: (-1)@(-1) to: 4@(-1).
canvas reflect: a axis: d
item, point, segment, line, ray, vector, circle, arc, polygon
vector, vector or coordinates
⇒ transformed object
| canvas u a|
canvas := DrGeoSketch new.
u := canvas vector: (canvas point: 1@1) to: (canvas point: 3@2).
a := canvas translate: (canvas point: 2@1) vector: u.
| canvas u a|
canvas := DrGeoSketch new.
a := canvas translate: (canvas point: 2@1) vector: 2@1.
m, mobile point on a line
c, fixed point depending on the mobile point m
⇒ locus
canvas locusOf: c when: mobile.
o, point or coordinates, vector origin
e, point or coordinates, vector extremity
⇒ vector
| canvas b |
canvas := DrGeoSketch new.
b := canvas point: 0@5.
canvas vector: b to: -1 @ -2.
p, point or coordinates, the vector coordinates
⇒ vector from 0@0 to point
| canvas p |
canvas := DrGeoSketch new.
p := canvas point: 5@5.
canvas vector: p.
canvas vector: -5 @ -5
When applying a method to a canvas that creates a numeric value, the value is placed as a Dr.Geo math item somewhat at random in the sketch, and is initially hidden. It can be revealed with the show command described below.
pointItem, point
⇒ coordinates (static) of self
| canvas c p segment |
canvas := DrGeoSketch new.
segment := canvas segment: 0@0 to: 3@5
p := canvas pointOnCurve: segment at: 0.5.
c := p coordinates.
canvas freeValue: c x
item, point or vector item
⇒ abscissa (dynamic) item of item
| canvas m x |
canvas := DrGeoSketch new.
m := canvas middleOf: 10@5 and: 7@8.
x := canvas abscissaOf: m.
The abscissa of a point is its x coordinate. The abscissa of a vector is the difference between the x coordinates of its initial and final points.
item, point or vector item
⇒ ordinate (dynamic) item of item
| canvas m x |
canvas := DrGeoSketch new.
m := canvas middleOf: 10@5 and: 7@8.
x := canvas ordinateOf: m
The ordinate of a point is its y coordinate. The ordinate of a vector is the difference between the y coordinates of its initial and final points.
v, initial value
⇒ free value item, initially hidden, randomly placed
v:= canvas freeValue: (-1 arcCos).
v show
item, a free value item
aNumber, a number
Eedit the value of a free number item
v := canvas freeValue: 3.
v show.
v value: Float pi
item, segment, circle, arc or vector
⇒ number item, the item length
canvas lengthOf: v1.
item, line or point
point, point
⇒ number, distance between two points or a point and a line
canvas distance: l1 to: a.
line, line
⇒ number, slope of the line
| canvas p |
canvas := DrGeoSketch new.
p := canvas slopeOf: d.
Dr.Geo does not handle infinite slope for vertical lines well. If a slope is placed in a sketch, and then the line is made vertical, the slope disappears from the sketch, and its value does not update in the data pane.
a, point
b, point, angle summit
c, point
⇒ geometric angle ABC in the interval [0 ; pi]
| canvas a b c angle |
canvas := DrGeoSketch new.
a :=canvas point: 0@0.
b :=canvas point: 0@4.
c :=canvas point: 3@0.
angle  := canvas angle: b to: a to: c.
angle show.
v1, vector
v2, vector
⇒ oriented angle given two vectors in the interval ]-pi ; pi]
| canvas v1 v2 a b c angle |
canvas := DrGeoSketch new.
a :=canvas point: 0@0.
b :=canvas point: 0@4.
c :=canvas point: 3@0.
v1 := canvas vector: a to: b.
v2 := canvas vector: a to: c.
angle  := canvas angle: v2 to: v1.
angle show.
item, line or circle
⇒ equation of the line or circle
| canvas e d |
canvas := DrGeoSketch new.
d := canvas line: 0@0 to: 15@13.
e := canvas equationOf: d.
e show.
string, a string
⇒ a text arbitrary positioned
canvas text: 'Hello'
string, a string
point, coordinates
⇒ a text positioned at aPoint
canvas text: 'Hello,
I am happy!' at: 0@0
item, an item representing a text
aString, a string
Edit the text of a text object
myText := canvas text: 'Hello'.
myText text: 'Bye'
To modify object attributes, we send messages to the objects. So the attributes are always modified after creating the objects.
aColor, a Color, see methods in this class for existing colors : Color black, Color red, Color blue, Color orange, Color yellow,...
Modify the item color
pointA color: Color green.
aColor, a Color
Modify the background color of the text item
myText backgroundColor: Color green.
aString, a string, text
Rename item
segment name: '[AB]'.
Hide an item
point hide
Show an item
value show
Set thickness of line to small
circle small.
Set thickness of line to normal
arc normal.
Set thickness of line to large
polygon large.
Plain, undotted, style line
polygon plain.
Dash style line
polygon dashed.
Dotted style line
arc dotted.
Cross shape for point
a cross.
Round shape for point
a round.
Square shape for point
a square.
Small sized point
a small.
Medium sized point
a medium.
Large sized point
a large.
point, coordinates
Move the item to the given position, if its constraints permit
| canvas a |
canvas := DrGeoSketch new.
a := canvas point: 0@0.
a moveTo: 5@5.
canvas update
The DrGeoSketch class proposes in the category helpers complementary methods to ease the computation of complex, interactive sketches.
block, block of code, with one argument, to describe a function on an interval
x0, number, lower boundary of the function’s domain
x1, number, upper boundary of the function’s domain
Display the curve representing the function described by the block of code, in the interval [x0 ; x1], and display a free point on the x axis together with a relative point on the curve, representing the value of the function at that point.
canvas plot: [:x| x * x] from: -3 to: 3.
f1, initial value
p, left position of the ruler
f2, minimum value
f3, maximum value
s, name of the value
⇒ block of code returning the current value of the ruler
Construct a ruler at the given position with a decimal value in the interval [float2 ; float3]
| canvas A F |
canvas := DrGeoSketch new.
A := canvas float: 1 at: -10@4 from: 0 to: 10 name:  'A'.
F := canvas integer: 3 at: -10@3 from: 0 to: 10 name: 'F' showValue: true.
A value + F value.
There are other variants, some for integer values.
To illustrate the use of Dr.Geo Smalltalk sketches, we present below a small set of examples. It shows you some possibilities that we hope will inspire you for your own needs. For each example for which we give the Smalltalk source code, we encourage you to copy and paste it into a Dr.Geo workspace and run the code.
These examples rely on time handling and background processes.
We begin with a simple animation in order to understand the concept:
| figure p pause |
figure:=DrGeoSketch new.
p := figure point: 0@0.
pause := Delay forSeconds: 0.2.
figure do: [
   100 timesRepeat: [
      p mathItem moveTo: (p mathItem point + (0.1@0)).
      figure update.
      pause wait]].
The Delay class supports setting time intervals for pausing
Dr.Geo. The do: and timeRepeat: control structures
repeat a code block that moves its argument item across the
sketch. The update is necessary so that the point is displayed in its
new position after each move.
A second example with a more elaborate sketch:
| figure s r u pause |
figure := DrGeoSketch new fullscreen.
s := figure segment: 0@ -1 to: 4@ -1.
r := figure pointOnCurve: s at: 0.8.
s := figure segment: 0@0 to: 0@1.
u := figure pointOnCurve: s at: 0.7.
u round small; color: Color blue.
1 to: 100 do: [:n|
   u := figure
      point: [:parents| |y t|
         y := parents first point y.
         t := parents second point x.
         (n / 5) @ t * y * (1 - y)]
      parents:  {u . r}.
   u round small; color: Color blue].
pause := Delay forSeconds: 0.1.
figure do: [
   0 to: 1 by: 0.05 do: [:x |
      r mathItem setCurveAbscissa: x.
      figure update.
      pause wait]].
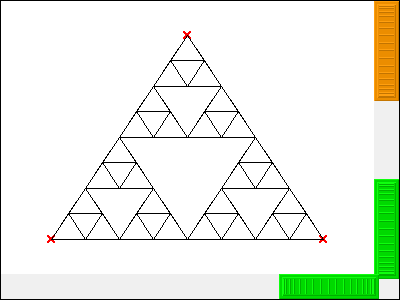
This example largely relies on a recursive block of code for drawing triangles and subdividing them to a specified number of levels.
| triangle c |
triangle := [:s1 :s2 :s3 :n |
    c segment: s1 to: s2;
        segment: s2 to: s3;
        segment: s3 to: s1.
    n > 0 ifTrue:
        [triangle
            value: s1
            value: (c middleOf: s1 and: s2) hide
            value: (c middleOf: s1 and: s3) hide
            value: n-1.
        triangle
            value: (c middleOf: s1 and: s2) hide
            value: s2
            value: (c middleOf: s2 and: s3) hide
            value: n-1.
        triangle
            value: (c middleOf: s1 and: s3) hide
            value: (c middleOf: s2 and: s3) hide
            value: s3
            value: n-1.]].

c := DrGeoSketch new.
triangle
    value: (c point: 0 @ 3)
    value: (c point: 4 @ -3)
    value: (c point: -4 @ -3)
    value: 3.
Next: Didactic applications, Previous: Smalltalk script, Up: Top [Contents][Index]